

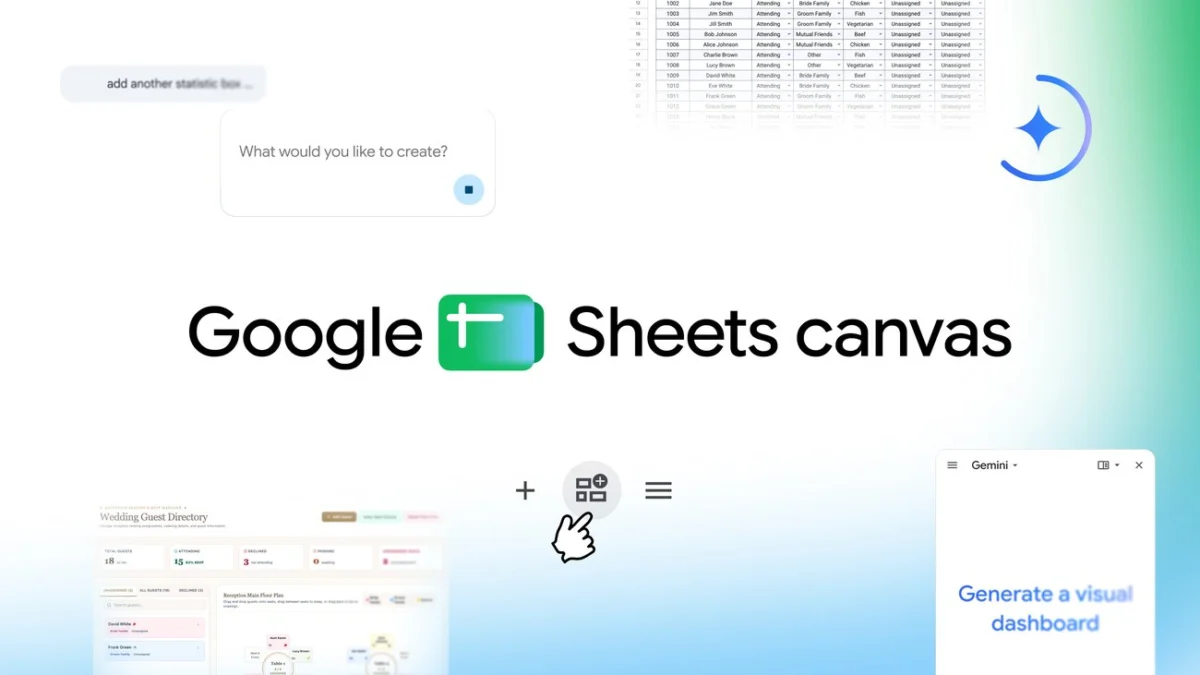
Google has officially announced the launch of Sheets canvas, a significant evolution for Google Sheets that integrates the Gemini generative AI framework to transform traditional row-and-column data into interactive, visual dashboards and customized mini-applications. This development marks a pivotal shift in the productivity software landscape, moving away from static data entry toward dynamic, user-defined interfaces. By utilizing natural language prompts, users can now reinterpret their spreadsheet data as seating charts, study trackers, project management hubs, or complex financial dashboards without requiring advanced coding or design skills.
The introduction of Sheets canvas addresses a long-standing challenge in data management: the cognitive load associated with interpreting large volumes of raw data. While spreadsheets have remained the backbone of business and personal organization for decades, the transition from data storage to data visualization has often required third-party tools or complex pivot tables. Google’s new feature aims to bridge this gap by providing a "read-write layer" that sits atop the existing spreadsheet, allowing for a fluid interaction between the data source and its visual representation.
The Mechanics of Sheets Canvas and Gemini Integration
At its core, Sheets canvas functions as a dynamic overlay. Unlike traditional charts or graphs, which are typically static representations of a specific data set, the canvas layer is bi-directional. When a user makes a change within the visual interface—such as dragging a guest to a different table in a seating chart—the underlying spreadsheet data updates automatically. This synchronization ensures that the "source of truth" remains accurate while providing a more intuitive user experience.
The integration with Gemini, Google’s suite of large language models (LLMs), is the engine behind this transformation. Users access the feature via the "Ask Gemini" side panel. By entering a simple natural language prompt, such as "Create a dashboard to track my freelance income by month" or "Organize these assignments into a weekly study schedule," the AI analyzes the structure of the existing sheet and generates a corresponding visual layout. This capability represents a significant advancement in the "No-Code" movement, empowering non-technical users to build functional interfaces that previously would have required specialized software or developer intervention.
A Chronology of Google Sheets Evolution
The release of Sheets canvas is the latest milestone in a nearly two-decade journey for Google’s spreadsheet software. To understand the significance of this update, it is necessary to look at the timeline of Google Sheets’ development:
- 2006: The Genesis. Google launched "Google Spreadsheets" following the acquisition of 2Web Technologies. It was a revolutionary web-based alternative to desktop-bound software like Microsoft Excel, emphasizing real-time collaboration.
- 2010–2014: Feature Parity. Google focused on closing the gap with legacy software, adding support for complex formulas, pivot tables, and offline editing.
- 2018: Artificial Intelligence Integration. Google introduced "Explore," a feature that used machine learning to suggest charts and provide automated data analysis.
- 2021: Smart Canvas. Google launched the "Smart Canvas" initiative, introducing "Smart Chips" (@-mentions) and building blocks that allowed Sheets to interact more seamlessly with Docs and Meet.
- 2023: The Generative AI Era. Google announced "Help me organize" in Sheets, allowing users to generate entire table structures from text prompts.
- 2024–2025: Sheets Canvas. The current launch represents the culmination of these efforts, moving from generating data structures to generating entire interactive user interfaces.
Diverse Use Cases: From Education to Enterprise
Google has highlighted several primary use cases to demonstrate the flexibility of Sheets canvas. These examples illustrate how the tool can be applied across different sectors:
Academic Management and Student Productivity
For students managing heavy course loads, Sheets canvas can transform a chronological list of assignments into an interactive study aid. By visualizing deadlines and progress bars, the tool helps students prioritize tasks. The interactive nature allows for the setting of reminders and the visualization of the week ahead, turning a passive list into an active management tool.
Personal Planning and Event Coordination
One of the more complex tasks for individuals is event planning, such as a wedding. Sheets canvas allows users to take RSVP data and meal preferences and convert them into a visual seating chart. The drag-and-drop functionality simplifies the logistical challenge of arranging guests, with the assurance that the central spreadsheet remains the primary, updated record.
Sports Analytics and Leisure
In the realm of fantasy sports, the tool acts as a "command center." Users can create custom dashboards to track player performance, compare statistics side-by-side, and visualize league standings. This application demonstrates the tool’s ability to handle high-frequency data updates and present them in a way that facilitates quick decision-making.
Supporting Data and Market Context
The launch of Sheets canvas comes at a time when the demand for AI-integrated productivity tools is reaching a fever pitch. According to recent industry reports, the global productivity software market is expected to grow at a compound annual growth rate (CAGR) of over 14% through 2030. A significant driver of this growth is the integration of generative AI, which is estimated to add trillions of dollars in value to the global economy by increasing labor productivity.
Google Workspace currently boasts over 3 billion users globally, with more than 10 million paying customers. By embedding Gemini-powered features like Sheets canvas into its existing ecosystem, Google is positioning itself to capture a larger share of the enterprise market, particularly among small-to-medium businesses (SMBs) that lack the resources for custom software development.
Market analysts suggest that the "mini-app" approach could disrupt the specialized project management software market. Tools that previously required separate subscriptions may now find competition from within the Google Sheets environment, as users realize they can build bespoke versions of these tools using their existing data.
Official Responses and Industry Implications
Eric Birnbaum, Director of Product Management for Google Sheets, emphasized that the goal of Sheets canvas is to make data more accessible and actionable. "Spreadsheets are a powerful tool for organizing and understanding data, but staring at hundreds of rows and columns can sometimes feel a bit overwhelming," Birnbaum noted in the announcement. The sentiment reflects a broader industry trend toward "human-centric" data design.
While Google has not released specific statements from external partners yet, the reaction from the tech community has focused on the competitive pressure this places on Microsoft. Microsoft’s Copilot for Excel offers similar generative capabilities, but the "canvas" concept—a dedicated visual layer for interactive UI—represents a unique architectural approach by Google.
Availability and Technical Requirements
Sheets canvas is being rolled out through a tiered release strategy. As of the announcement, the feature is available globally in English for the following groups:
- Individual Subscribers: Those on Google AI Pro and Ultra plans.
- Business and Enterprise: Customers on Google Workspace Business Standard/Plus and Enterprise Standard/Plus plans.
- Education: Subscribers to the Google AI Pro for Education add-on.
Users can activate the feature by opening a Google Sheets file and selecting "Create canvas" within the "Ask Gemini" side panel. Google has also provided documentation and support articles to assist users in crafting effective prompts to get the most out of the AI transformation.
Fact-Based Analysis of Future Implications
The long-term implications of Sheets canvas extend beyond simple data visualization. By turning spreadsheets into "mini-apps," Google is effectively lowering the barrier to entry for software creation. This democratization of app development could lead to a proliferation of user-generated tools within organizations, tailored to specific workflows that off-the-shelf software cannot adequately address.
However, this shift also raises questions regarding data governance and security. As users create more complex interactive layers on top of sensitive data, organizations will need to ensure that these "canvases" adhere to corporate compliance standards. Google’s integration of these features within the existing Workspace infrastructure suggests that current security protocols will apply, but the increased complexity of the data interface will likely require new best practices for administrators.
Furthermore, the reliance on generative AI for UI design introduces a level of unpredictability. The accuracy of the "canvas" depends heavily on the clarity of the user’s prompt and the cleanliness of the underlying data. As the technology matures, it is expected that Gemini will become more adept at handling "messy" data and providing even more sophisticated design suggestions.
In conclusion, Sheets canvas represents a significant step toward the future of work, where the boundary between data and application continues to blur. By leveraging the power of Gemini, Google is not just helping users see their data; it is enabling them to interact with it in ways that were previously the exclusive domain of professional developers. This evolution reflects a broader commitment to making powerful technology accessible to all, fundamentally changing how we perceive and use the humble spreadsheet.
