

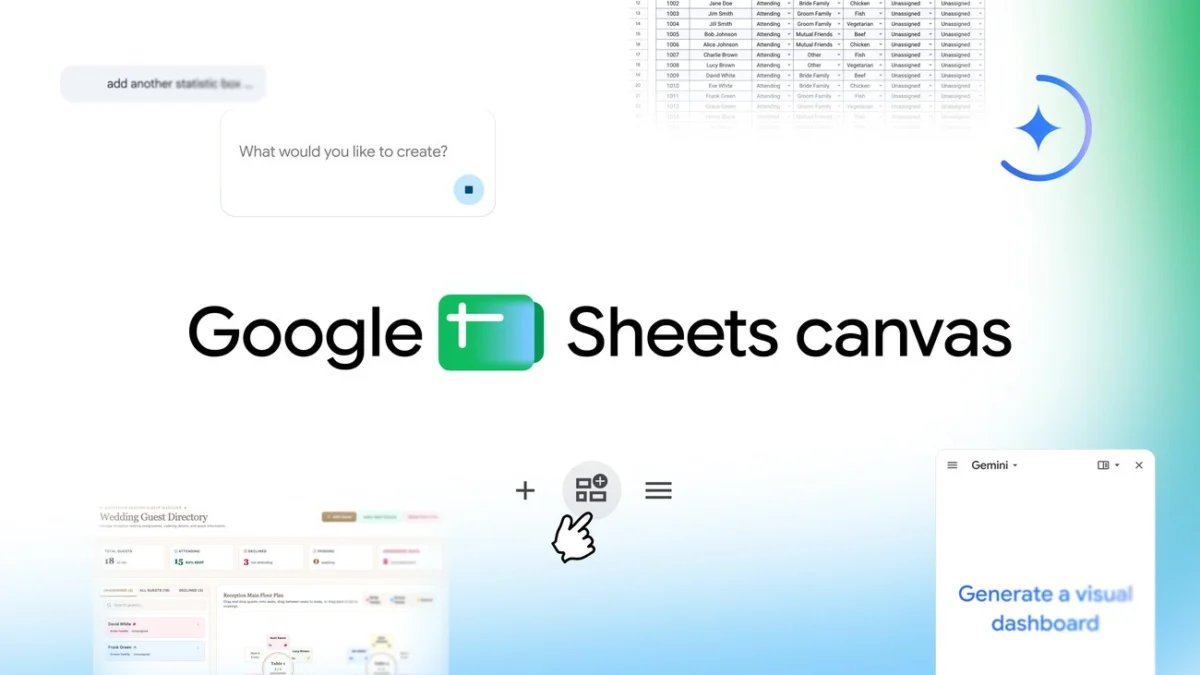
Google has officially announced the launch of Sheets canvas, a transformative feature for Google Sheets that utilizes the Gemini generative AI framework to convert traditional row-and-column data into interactive, customizable "mini-apps." This development marks a significant shift in the evolution of spreadsheet software, moving beyond static data entry and basic charting toward a dynamic, user-centric interface designed for immediate utility and visualization. According to Eric Birnbaum, Director of Product Management for Google Sheets, the tool is designed to alleviate the cognitive load associated with managing large datasets by allowing users to interact with their information through a visual layer that sits directly atop the spreadsheet.
The introduction of Sheets canvas represents a strategic move by Google to integrate sophisticated artificial intelligence into its core productivity suite. By using natural language prompts, users can now instruct Gemini to generate specific layouts—such as study trackers, seating charts, or financial dashboards—without requiring advanced knowledge of pivot tables, VLOOKUP functions, or complex formatting rules. This "read-write" layer ensures that any changes made within the visual canvas are reflected in the underlying data and vice versa, maintaining a single source of truth while providing a more intuitive user experience.
The Evolution of the Spreadsheet: From Ledger to Interface
To understand the impact of Sheets canvas, it is necessary to examine the historical trajectory of spreadsheet software. Since the debut of VisiCalc in 1979 and the subsequent dominance of Lotus 1-2-3 and Microsoft Excel, the fundamental structure of the spreadsheet has remained largely unchanged: a grid of cells defined by alphanumeric coordinates. While powerful, this structure often presents a barrier to entry for complex project management or visual organization.
In recent years, the rise of "no-code" and "low-code" platforms has signaled a growing demand for tools that allow non-technical users to build functional interfaces from their data. Competitors such as Airtable and Notion have gained significant market share by offering database-driven layouts that prioritize visual organization over the traditional grid. Sheets canvas is Google’s direct response to this trend, leveraging the ubiquitous nature of Google Sheets—which serves over 3 billion users worldwide as part of Google Workspace—and enhancing it with the generative capabilities of Gemini AI.
Chronology of AI Integration in Google Workspace
The rollout of Sheets canvas is the latest milestone in a multi-year effort by Google to infuse AI across its productivity ecosystem. The timeline of this integration highlights a steady progression from simple text generation to complex data manipulation:
- Late 2022: Google begins experimenting with early generative models to assist in drafting emails in Gmail and documents in Google Docs.
- May 2023: At the Google I/O developer conference, the company introduces "Duet AI" for Workspace, featuring "Help me organize" in Sheets, which allowed users to generate table templates via prompts.
- Early 2024: Google rebrands its AI efforts under the "Gemini" umbrella, integrating more powerful multimodal models capable of understanding context across different file types.
- August 2024: The official unveiling of Sheets canvas, moving beyond simple templates to create fully interactive, persistent visual layers that function as bespoke applications within the spreadsheet environment.
Technical Functionality and Key Use Cases
The primary innovation of Sheets canvas is its ability to interpret the intent behind a user’s data and suggest a layout that maximizes its utility. Unlike a standard chart, which is a static representation of data, the canvas is an "active" environment. Users can drag and drop elements, update statuses, and navigate complex hierarchies through a simplified UI.
Google has highlighted three primary use cases that demonstrate the versatility of the tool:
- Academic Management: Students managing heavy course loads can transform a list of assignments, deadlines, and grades into an interactive study aid. The canvas can visualize the week ahead, set reminders, and provide a dashboard of academic progress, turning a daunting list into a manageable schedule.
- Sports and Hobbyist Tracking: In the realm of fantasy sports, the canvas acts as a "command center." Users can pull in player statistics and roster data to create side-by-side comparisons and performance trackers. This shifts the spreadsheet from a storage container into a strategic tool.
- Event Planning and Logistics: For complex events like weddings, the canvas can transform RSVP lists into an interactive seating chart. Planning logistics—such as meal choices and table assignments—becomes a visual task. Users can move guests between tables on the canvas, and the underlying sheet updates automatically to reflect these changes.
Supporting Data and Market Implications
The demand for such tools is supported by industry data regarding workplace productivity. According to research by Gartner, by 2026, 80% of software engineering organizations will have integrated AI-augmented tools into their workflows, but the impact is expected to be even greater among non-technical "citizen developers." Google’s move to democratize app-like interfaces within Sheets targets the massive segment of the workforce that uses spreadsheets for project management rather than pure financial modeling.
Internal data from Google suggests that a significant portion of Sheets users utilize the platform for "tracking" rather than "calculating." By providing a visual layer, Google aims to reduce "context switching"—the time lost when users move between a spreadsheet and a separate project management tool. Keeping the workflow contained within a single document increases efficiency and data integrity.
Official Responses and Strategic Positioning
In his announcement, Eric Birnbaum emphasized that the goal of Sheets canvas is to make data "easy to understand and even easier to use." This reflects a broader philosophy at Google Cloud and Workspace: making AI a collaborative partner rather than just a search or generation tool.
Industry analysts suggest that this feature is a critical defensive and offensive move against Microsoft’s Copilot in Excel. While Microsoft has focused heavily on using AI for data analysis and formula generation, Google’s "canvas" approach focuses on the interface and the user experience of data. This distinction is vital for capturing users who find the traditional Excel interface intimidating or overly rigid.
Broader Impact on Education and Small Business
The implications of Sheets canvas extend beyond personal organization into the professional and educational sectors. For small businesses, the ability to create "mini-apps" for inventory management, lead tracking, or employee scheduling without hiring a developer is a significant value proposition. It reduces the barrier to digital transformation for enterprises with limited budgets.
In education, the tool provides a bridge for students to learn data literacy. By interacting with a visual canvas, students can more easily grasp how data inputs affect outcomes, fostering a deeper understanding of information architecture without the steep learning curve of traditional spreadsheet syntax.
Availability and Subscription Tiers
Google has initiated a phased rollout of Sheets canvas to ensure stability and gather user feedback. As of the announcement, the feature is available globally in English for the following groups:
- Google AI Pro and Ultra Subscribers: Individual users who have opted into Google’s premium AI tiers.
- Google Workspace Customers: Specifically those on Business Standard, Business Plus, Enterprise Standard, and Enterprise Plus plans.
- Education Subscribers: Users with the Google AI Pro for Education add-on.
To access the feature, eligible users can open any Google Sheets spreadsheet and select the “Create canvas” option located within the "Ask Gemini" side panel. Google has also released comprehensive support documentation to assist users in crafting effective prompts to get the most out of the new visual layer.
Conclusion: The Future of Interactive Data
Sheets canvas represents a pivot point where the spreadsheet ceases to be a mere digital ledger and becomes a foundation for personalized software. By leveraging Gemini AI to bridge the gap between raw data and functional interfaces, Google is redefining the expectations for productivity software. As generative AI continues to evolve, the distinction between "data" and "application" is likely to blur further, with Sheets canvas serving as an early blueprint for this integrated future. The success of the tool will ultimately be measured by its ability to turn the "overwhelming" rows and columns of the modern workplace into clear, actionable, and visual insights.
