

The Evolution of the Spreadsheet Interface
For over four decades, the fundamental structure of the spreadsheet—the grid of cells—has remained largely unchanged. From the early days of VisiCalc and Lotus 1-2-3 to the modern dominance of Microsoft Excel and Google Sheets, the paradigm of columns and rows has served as the backbone of global finance, science, and administration. However, as data sets have grown in complexity and users have increasingly sought more intuitive ways to interact with their information, the limitations of the grid have become more apparent.
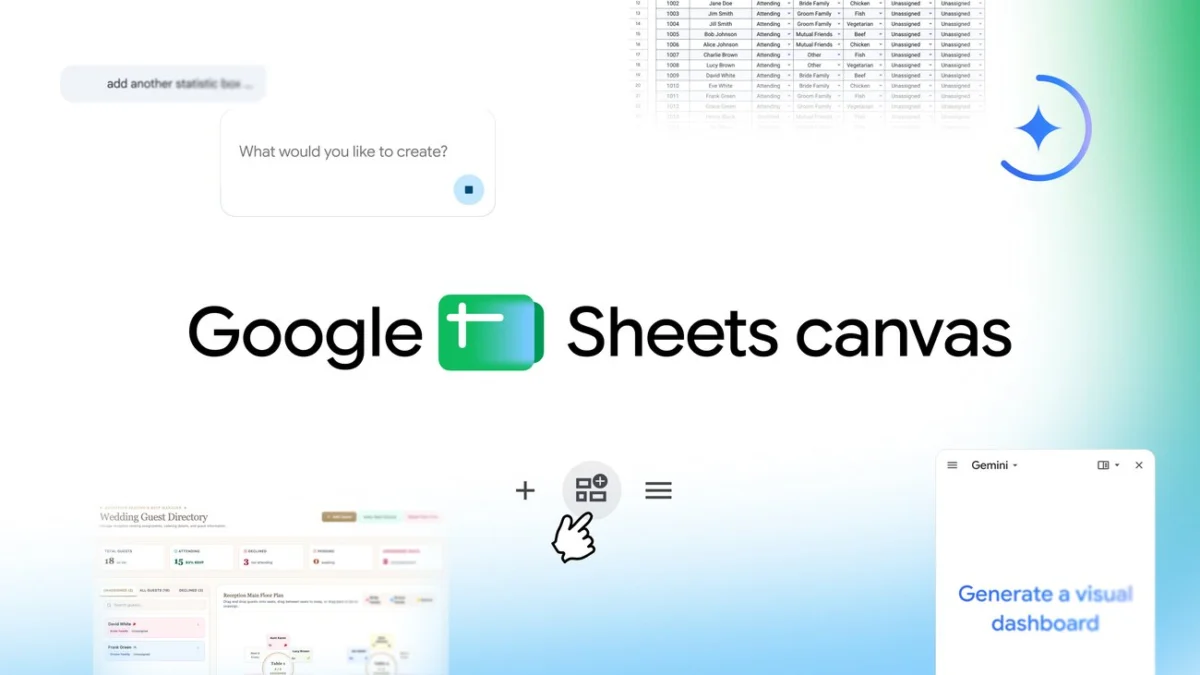
The introduction of Sheets canvas marks a departure from this traditional constraint. According to Eric Birnbaum, Director of Product Management for Google Sheets, the feature acts as a "dynamic, read-write layer" that sits atop existing spreadsheet data. This architecture ensures that while the visual representation changes, the underlying data remains synchronized. Users can manipulate information within the canvas—such as moving items on a seating chart or updating a project status—and those changes are reflected instantly in the original grid, and vice versa.
Technical Architecture and AI Integration
At the heart of Sheets canvas is Gemini, Google’s most capable family of AI models. The integration allows the software to interpret high-level human intent and translate it into functional UI components. When a user enters a prompt—such as "Create a dashboard for my wedding planning data"—the AI analyzes the existing headers, data types, and relationships within the sheet. It then generates a layout featuring buttons, sliders, progress bars, and drag-and-drop elements tailored to that specific context.
This capability falls under the emerging category of "Generative UI," where software interfaces are not hard-coded by developers but are instead assembled on-the-fly by AI to suit the user’s immediate needs. This significantly lowers the barrier to entry for creating specialized tools, effectively democratizing "no-code" development for the average office worker or student.
Practical Applications and Use Cases
Google has highlighted several primary sectors where Sheets canvas is expected to have an immediate impact: education, personal organization, and small business management.
1. Academic Management and Student Productivity
In the educational sector, the volume of data students must track—syllabi, assignment deadlines, grades, and study hours—can be overwhelming when viewed as a standard list. Sheets canvas can transform these lists into interactive study trackers. Students can visualize their week ahead through custom calendars, set automated reminders, and use progress trackers that provide visual feedback as tasks are completed. This transition from a "to-do list" to a "command center" is designed to improve executive function and time management.
2. Event Planning and Logistics
One of the most labor-intensive uses of spreadsheets is event planning, particularly for tasks involving spatial arrangements like wedding seating charts. Historically, this required users to manually update cell coordinates or use third-party design software. Sheets canvas introduces a drag-and-drop interface where guest RSVP data is represented by movable icons. Users can organize guests into tables visually; the underlying spreadsheet automatically updates the table assignments in the background, ensuring that catering lists and name cards remain accurate without manual data entry.
3. Professional Sports and Analytics
The rise of fantasy sports has turned millions of casual fans into amateur data analysts. For fantasy football enthusiasts, Sheets canvas offers a way to build a "roster command center." By pulling in player statistics and performance metrics, users can create dashboards that compare athletes side-by-side using visual charts rather than raw numbers. This allows for quicker decision-making regarding trades and weekly lineups, leveraging AI to highlight trends that might be buried in hundreds of rows of data.
Market Context and Competitive Landscape
The launch of Sheets canvas is a strategic move in the increasingly competitive "productivity war" between Google, Microsoft, and specialized no-code platforms like Airtable and Notion. While Airtable has long offered "interfaces" that sit on top of databases, Google’s advantage lies in its massive existing user base and the seamless integration of Gemini.
Market analysts suggest that the integration of AI into productivity tools is no longer a luxury but a necessity for retention. Microsoft has been aggressive in rolling out its "Copilot" across the Office 365 suite, including Excel. However, Google’s approach with Sheets canvas focuses heavily on the visual transformation of data, whereas many current AI implementations in spreadsheets focus on formula generation or data cleaning. By providing a "canvas," Google is betting that users want to interact with their data in a way that feels more like a modern app and less like a financial ledger.
Chronology of Development and Rollout
The development of Sheets canvas follows a series of AI-centric updates to Google Workspace over the past 18 months. Following the public release of Gemini (formerly Bard), Google began integrating "Help me organize" features into Sheets, which allowed users to generate templates. Sheets canvas represents the "Phase 2" of this evolution—moving from generating the structure of data to generating the interface for data.
The global rollout began in August 2024, with English-language support being the initial priority. The feature is being deployed in a tiered release:
- Immediate Access: Available to Google AI Pro and Ultra subscribers.
- Enterprise and Business Tiers: Rolling out to Google Workspace customers on Business Standard, Business Plus, Enterprise Standard, and Enterprise Plus plans.
- Education: Available to Google AI Pro for Education add-on subscribers.
Users can access the feature by opening the "Ask Gemini" side panel within any Google Sheets file and selecting the "Create canvas" option.
Data Security and Privacy Implications
As with any AI-driven tool that processes user data, questions regarding privacy and security are paramount. Google has stated that for Workspace Enterprise and Business customers, data used to prompt Gemini or processed within Sheets canvas is not used to train the company’s underlying global models without explicit permission.
The "read-write layer" architecture also ensures that data integrity is maintained. Because the canvas is a view of the data and not a separate copy, there is no risk of version-control conflicts between the "app" and the "spreadsheet." This is a critical factor for business users who rely on the spreadsheet as the "single source of truth" for financial or operational auditing.
Broader Implications for the Future of Work
The long-term implications of Sheets canvas suggest a shift in the definition of digital literacy. In the past, "knowing Excel" meant understanding complex VLOOKUP functions and pivot tables. In the era of Sheets canvas, the required skill set shifts toward "prompt engineering" and "systems thinking."
Furthermore, this technology may reduce the demand for bespoke, low-level software development within corporations. If a department head can create a custom CRM or inventory management tool in 10 minutes using a spreadsheet and an AI prompt, the reliance on internal IT departments for minor application development could decrease.
Conclusion
Sheets canvas represents a significant milestone in Google’s mission to integrate artificial intelligence into the daily workflows of billions of users. By removing the friction between data entry and data visualization, Google is attempting to redefine the spreadsheet as a flexible canvas for creativity and management. As the rollout continues and more languages and features are added, the impact on how individuals and businesses interact with information is likely to be profound, signaling the end of the era where the grid was the only way to view the world’s data.
